


Introduction
Every online project starts with a domain. Behind a domain sits an entire industry, one that moves in step with how technology evolves and where demand is heading.
This report is built for anyone with a stake in that industry: internet-focused companies, domain investors, and end users who want to understand where the market is going. It draws on two sources: Dynadot's platform data and an April 2026 survey of 134 domain industry participants. It's created to give a grounded, data-backed read on Q1 2026.
What the data shows isn't a single growth story. Some extensions surged, some held steady, and others dropped sharply in the same quarter.
This report covers all of it:
- Which top-level domains (TLDs) moved and why.
- Where regional demand shifted.
- How investor and retail behavior differed.
- What aftermarket and retention signals say about the health of demand beneath the surface.
Executive Summary
- Total domain registrations increased 40% year over year, but TLD growth was uneven across extensions.
- .com remained the largest TLD, while .info, .digital, .sbs, .pro, .vip, .org, and .top drove most of the visible growth.
- Survey respondents most often cited startup and tech demand as the main growth driver (62%), but the survey should be read as investor-heavy directional sentiment.
- 41% of respondents said new gTLDs were the fastest-growing category, yet 49% said they personally registered more legacy gTLDs year over year.
- Regional sentiment and platform data overlap but are not identical: respondents most often named North America (37.3%) and Asia-Pacific (31.3%) as fastest-growth regions, while Asia remained the largest platform region.
- Aftermarket buying was mixed in the survey (28% increased), while platform aftermarket activity was strongly concentrated in .com.
Key numbers at a glance
We track domain market trends through our regular surveys and internal company data to stay close to what's actually happening across the industry. We share what we find openly, whether you're a domain investor, a business owner, or simply someone building something online.
Here are the five top things we learned in Q1 2026:
| Signal | Reported figure |
| Total registration growth | +40% YoY |
| Aftermarket activity growth | +46% YoY |
| Investor share of platform registrations | 75% to 87% |
| API registration growth | +98% YoY |
| Grace-delete rate | 1.82% to 2.77% |
| Survey sample | 134 opt-in responses; 68% investor or side-investor |
Methodology
Platform data
This data covers Dynadot registration and marketplace activity from January 2025 through March 2026. The main comparison is Q1 2026 vs. Q1 2025. To show relative growth without publishing raw counts, we use index values: Q1 2025 = 100, so an index of 725 means activity was 7.25x the prior-year level. Index values are paired with activity ranks throughout, so trends are easily visible.
Regions: North America, Europe, Asia, South America, Africa, Middle East, Oceania, and Other.
User types: investor and retail, based on Dynadot account behavior.
Survey data
Survey data is based on our internal survey of 134 domain industry participants conducted in April 2026. The majority of the respondents base leans heavily toward investors: 68% identified as full-time or part-time domain investors. Survey results are treated as directional market sentiment, not a representative sample of the broader domain market.
All data in this report is sourced exclusively from Dynadot's internal platform and the April 2026 survey. If you're referencing specific figures, please refer to: Dynadot Domain Intelligence Report: Q1 2026. Published 2026.
Survey Sentiment Snapshot (Survey Only)
These results come from our April 2026 survey only. Because the respondent base is investor-heavy, treat this as directional market sentiment rather than a read on all domain buyers.
The gap between perception and behavior is worth noting: 41% believed new gTLDs were the fastest-growing category, but nearly half said their own purchases shifted toward legacy, generic TLDs (gTLDs). What investors believe is moving and what they actually register don't always match.
The aftermarket activity had a strong increase of 28%, which shows the importance of domain names and growing demand.
| April 2026 survey area | Leading response | Share |
| Respondent profile | Investor / side-investor | 68% |
| Growth driver | Startup and tech-sector demand | 62% |
| Perceived fastest growth | New gTLDs | 41% |
| Self-reported buying shift | More legacy gTLDs YoY | 49% |
| Regional perception | North America / Asia-Pacific | 37% / 31% |
| ccTLD behavior | Occasional or frequent ccTLD use | 52% |
| Aftermarket behavior | Increased buying | 28% |
1. TLD Momentum
Total registrations grew 40% year over year, but that growth was not spread evenly. A handful of extensions drove most of the movement, while others stayed flat or fell sharply. The tables below show where the acceleration happened, and provide rank context so a large index number doesn't overstate significance.
.digital moved from a lower prior-year activity rank into the top 10, while .com remained #1 with a much smaller index. That pattern shows acceleration around specific TLDs rather than a simple shift away from the largest legacy anchor.
Fastest-growing TLDs by growth contribution
What this table includes: the fastest-moving TLDs by Q1 2026 growth contribution, with Q1 2025 rank, Q1 2026 rank, index, and year-over-year movement.
| TLD | Q1 2025 rank | Q1 2026 rank | Growth index | YoY |
| .digital | #56 | #9 | 2,086 | +1986% |
| .info | #17 | #3 | 725 | +625% |
| .pro | #15 | #10 | 323 | +223% |
| .sbs | #12 | #7 | 299 | +199% |
| .cfd | #20 | #14 | 256 | +156% |
| .vip | #6 | #4 | 193 | +93% |
| .org | #7 | #8 | 174 | +74% |
| .top | #2 | #2 | 165 | +65% |
| .click | #5 | #5 | 147 | +47% |
| .com | #1 | #1 | 109 | +9% |
Reading index with rank context: .digital's index of 2,086 is meaningful because it climbed from rank #56 to #9 and it became a top-10 extension. .com stayed #1 with a much smaller index of 109.
Top TLD rankings: Q1 2025 vs. Q1 2026
The top of the list wasn't replaced wholesale. .com and .top held their positions at #1 and #2. The main change was .info and .digital entering the top 10, and legacy TLDs like .cc, .net, and .gdn falling or dropping out entirely.
| Rank | Q1 2025 | Rank | Q1 2026 |
| #1 | .com | #1 | .com |
| #2 | .top | #2 | .top |
| #3 | .cc | #3 | .info |
| #4 | .xyz | #4 | .vip |
| #5 | .click | #5 | .click |
| #6 | .vip | #6 | .cc |
| #7 | .org | #7 | .sbs |
| #8 | .co | #8 | .org |
| #9 | .net | #9 | .digital |
| #10 | .gdn | #10 | .pro |
Stable high-volume TLDs
.cc and .com grew modestly from already prominent positions, while .xyz and .net softened without the collapse seen in sharper-decline extensions
| TLD | Q1 2026 Ranking | Index | YoY |
| .cc | #6 | 111 | +11% |
| .com | #1 | 109 | +9% |
| .xyz | #11 | 99 | -2% |
| .net | #17 | 93 | -7% |
| .club | #23 | 114 | +14% |
| .live | #30 | 94 | -6% |
TLDs with sharp declines
The same quarter produced strong acceleration and sharp contraction in some extensions. That reinforces the need to evaluate TLD demand at the extension level rather than treating domain registrations as one uniform category.
| TLD | Q1 2026 Index | YoY |
| .gdn | 1 | -99% |
| .loan | 7 | -93% |
| .locker | 20 | -80% |
| .town | 2 | -98% |
| .academy | 2 | -99% |
| .buzz | 33 | -67% |
| .pizza | 3 | -97% |
| .mobi | 26 | -74% |
2. Regional Demand
Regional growth and regional share tell different stories. Asia held nearly half of all registrations but grew only modestly. Europe and South America grew much faster, even from different starting points. The TLD mix also varied region by region.
Regional growth differed from regional scale
This table includes Q1 2026 regional share and year-over-year movement from the platform data. It shows the difference between regional share and regional acceleration, since the largest region was not the fastest-growing region.
The largest region is Asia, and it holds 46% share, while the growth of this region is very modest (5%). On the other hand, South America has a smaller share but with a huge growth (269%).
| Region | Share of Q1 2026 registrations | YoY | Read |
| Asia | 46% | +5% | Largest platform region, but modest growth |
| Europe | 24% | +147% | Strong share and strong growth |
| North America | 23% | +63% | Large share, with clear growth |
| Middle East | 3% | +37% | Moderate growth |
| South America | 2% | +269% | Fast growth from smaller share |
| Africa | 2% | -19% | Lower year-over-year activity |
| Oceania | 0.2% | -3% | Small share, broadly stable |
TLD mix by region
What this table includes: the top Q1 2026 TLDs by regional activity and the TLDs contributing most to year-over-year regional growth. This makes the regional section TLD-specific instead of only describing overall regional movement.
What's notable is that each region's growth was driven by a different cluster of TLDs.
| Region | Top Q1 2026 TLDs by activity | Main YoY growth drivers | Observation |
| North America | .com, .info, .digital, .org, .top | .com, .info, .digital, .org, .top | .info and .digital drove most growth; .com held as volume anchor |
| Europe | .com, .pro, .click, .info, .digital | .pro, .click, .digital, .info, .com | .pro and .click contributed heavily; more non-.com-heavy than other regions |
| Africa | .com, .top, .vip, .cc, .xyz | .top, .vip, .sbs, .cyou, .click | .top and .vip held scale; .sbs and .cyou appeared in growth layer |
| South America | .sbs, .com, .click, .shop, .lat | .sbs, .click, .com, .shop, .lat | Growth was concentrated in a smaller set led by .sbs, .com, .click, .shop, and .lat. |
Survey read: respondents most often identified North America (38%) and Asia-Pacific (31%) as the fastest-growth regions. That perception broadly matches part of the platform view: Asia held the largest share, while North America showed strong acceleration.
Region perceived as seeing the most rapid domain growth
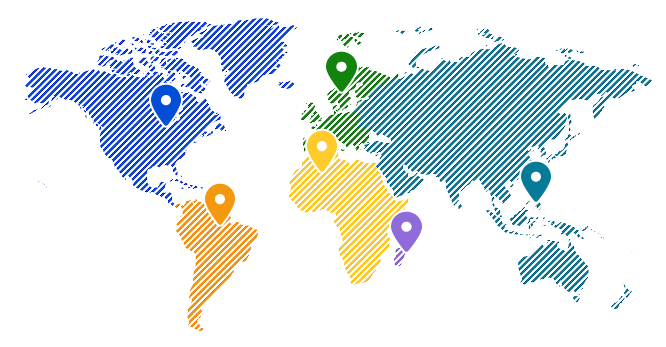
Regional demand is becoming more diversified, but the TLD mix differs by region. Europe and North America were growth stories, while Asia remained a scale story, and each region was carried by a different cluster of extensions.
3. Investor vs. Retail Behavior
Investors and retail buyers didn't move in the same TLDs. Some extensions appeared in both segments, but the overall mix was different. Here's what changed from Q1 2025 to Q1 2026, and what remained stable by audience type.
Investor growth leaders from Q1 2025 to Q2 2026 were: .info, .top, .com, .sbs, .pro, .vip. While volume anchors are .com and .top held the top positions throughout.
Retail growth leaders from Q1 2025 to Q2 2026 were: .digital, .online, .sbs, .info, .eu, .co.uk, .co, .app, .click, and .fr with . com volume anchor: .com led retail by a wide margin.
Investor and retail growth overlapped in some TLDs, especially: .digital, .sbs, .info, .click but the mix is different.
Investor Growth TLDs
Index values show growth relative to Q1 2025 (100 = flat). A high index paired with a large rank jump means genuine acceleration, not just movement from a small base.
| Growth Rank | TLD | 2025 → 2026 Rank | Investor Index |
| #1 | .info | #17 → #3 | 923 |
| #2 | .top | #2 → #2 | 180 |
| #3 | .com | #1 → #1 | 115 |
| #4 | .sbs | #14 → #7 | 396 |
| #5 | .pro | #13 → #8 | 382 |
| #6 | .vip | #5 → #4 | 197 |
| #7 | .digital | #111 → #11 | 8,855 |
| #8 | .org | #8 → #9 | 186 |
| #9 | .click | #4 → #6 | 152 |
| #10 | .cfd | #37 → #16 | 599 |
Retail Growth TLDs
| Growth Rank | TLD | 2025 → 2026 Rank | Retail Index |
| #1 | .digital | #25 → #2 | 892 |
| #2 | .online | #31 → #8 | 379 |
| #3 | .sbs | #6 → #3 | 132 |
| #4 | .info | #17 → #11 | 158 |
| #5 | .eu | #54 → #20 | 220 |
| #6 | .co.uk | #57 → #21 | 226 |
| #7 | .co | #22 → #13 | 138 |
| #8 | .app | #62 → #24 | 229 |
| #9 | .click | #12 → #9 | 116 |
| #10 | .fr | #103 → #34 | 423 |
Popular choices by volume
Growth tables show where new activity was concentrated. Volume tables show what people were actually registering most. They don't always point to the same TLDs.
| Growth Rank | Investor Top Choices | Retail Top Choices |
| #1 | .com | .com |
| #2 | .top | .top |
| #3 | .info | .sbs |
| #4 | .vip | .cc |
| #5 | .cc | .shop |
| #6 | .click | .xyz |
| #7 | .sbs | .org |
| #8 | .pro | .online |
| #9 | .org | .click |
| #10 | .xyz | .cfd |
Even as growth shifted, volume anchors were stable. Investors still registered the most .com and .top domains. Retail buyers still led with .com by a wide margin. The growth tables show where new activity was happening and the volume tables show what people were actually buying most.
Survey note: 68% of survey respondents were investors, so the survey data reflects investor sentiment more than retail. It's a useful signal for how investors see the market, but not a representative read on all buyers.
4. Acquisition and Aftermarket Signals
API registration activity nearly doubled year over year (+98), concentrated in a specific set of TLDs. Aftermarket activity grew 46%, and was heavily concentrated in .com across every service type.
API growth was strongest in specific TLD clusters
API growth is likely driven by scaled or investor-oriented users rather than typical registrants. Most survey respondents (90%) said they register domains through registrar websites. Only 5% named API as their primary method, but the growth of API registrations was very high - 98%. This suggests API growth in platform data is likely concentrated among scaled users rather than the broad respondent base.
| TLD | Share of API activity | API Index | YoY |
| .com | 25% | 191 | +91% |
| .top | 8% | 337 | +237% |
| .info | 7% | 675 | +575% |
| .click | 6% | 72 | -28% |
| .sbs | 6% | 630 | +530% |
| .xyz | 4% | 115 | +16% |
| .pro | 4% | 1,009 | +909% |
| .shop | 4% | 369 | +269% |
Registrar websites remain the default for most respondents, while API activity is a smaller but faster-moving platform signal.
Aftermarket activity was heavily TLD-specific
Aftermarket activity grew 46% year over year: but it wasn't evenly spread. .com dominated every service type, while a secondary layer of activity built around .org, .net, .cc, and .info. The tables below show the TLD breakdown by overall share and by service type.
What this table includes: Q1 2026 aftermarket activity shared by TLD, with index and year-over-year movement.
| TLD | Share of Q1 2026 aftermarket activity | Aftermarket Index | YoY |
| .com | 77% | 154 | +54% |
| .org | 5% | 144 | +44% |
| .net | 3% | 106 | +6% |
| .cc | 3% | 117 | +17% |
| .info | 1% | 215 | +115% |
| .xyz | 1% | 77 | -23% |
| .co | 1% | 68 | -32% |
| .io | 1% | 114 | +14% |
This table breaks down further by aftermarket path, and shows leading TLD share and secondary TLDs (other TLD mix by share) and their share by auction types (Closeout, Expired Auction, Marketplace Sale, User Auction, BIN Marketplace).
| Aftermarket service | Leading TLD (share) | Other TLD MIX (Share) | Leader Index / YoY |
| Closeout | .com (80%) | .cc (4%), .net (3%), .org (3%), .us (1%) | 173; 73% YoY |
| Expired Auction | .com (73%) | .org (7%), .net (5%), .cc (4%), .co (1%) | 124; 24% YoY |
| Marketplace Sale | .com (80%) | .cc (3%), .info (2%), .org (2%), .net (1%) | 203; 103% YoY |
| User Auction | .com (79%) | .org (3%), .info (2%), .net (2%), .ai (2%) | 346; 246% YoY |
| BIN Marketplace | .com (68%) | .org (5%), .info (3%), .net (3%), .app (2%) | 104; 4% YoY |
Registry Auction is excluded from this table, it's a narrower service and including it would over-weight a small-volume pattern.
.com was the dominant aftermarket TLD across every service type. But the secondary layer (.org, .net, .cc, and .info) was also growing. Aftermarket demand wasn't just a platform-level increase; it had a distinct extension mix beneath the surface.
Survey - How did aftermarket buying change year over year?
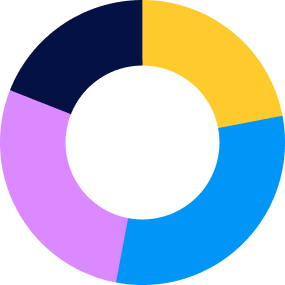
Survey read: aftermarket behavior was mixed, with:
- 28% reported increased aftermarket buying.
- 31% said activity stayed the same.
- 22% reported decreased buying.
- 19% said aftermarket buying was not applicable.
5. TLD Quality and Retention Signals
Two signals help assess how solid registration growth actually is: grace-delete rates (short-term cancellations within the refund window) and multi-year registrations (a proxy for longer-term intent). Neither should be read in isolation.
Grace-delete activity adds retention context to growth
The overall grace-delete rate increased from 1.82% in Q1 2025 to 2.77% in Q1 2026. Some TLDs appear both in growth and grace-delete views, so growth should be read alongside short-term deletion behavior.
| TLD | Registration Index | Registration YoY | Q1 2026 grace-delete rate | Grace-delete Index | Read |
| .top | 165 | 65% | 8% | 459 | High growth and elevated testing signal |
| .vip | 193 | 93% | 5% | 112 | Growth with moderate grace-delete signal |
| .org | 174 | 74% | 5% | 1,338 | Growth with higher short-term deletion caveat |
| .cc | 111 | 11% | 10% | 580 | Consistent high-volume TLD with elevated grace deletes |
| .xyz | 99 | -2% | 7% | 151 | Stable-to-soft registration movement with elevated grace deletes |
Elevated grace-delete indexes do not erase registration growth, but they change how growth should be interpreted. The index shows movement versus Q1 2025, while the actual grace-delete rate shows how large the short-term deletion signal was in Q1 2026.
TLDs with both growth and higher short-term deletion behavior may reflect more testing, promotion sensitivity, or portfolio pruning than TLDs where registrations are more likely to persist.
Multi-year registration: commitment signals
.dev had the highest multi-year rate at 5% and also saw the strongest index growth. For developer-oriented TLDs like .dev, .io, and .app, multi-year registration behavior may reflect more genuine long-term use rather than speculative holding.
| TLD | Q1 2026 Multi-Year Rate | Multi-Year Index | YoY |
| .dev | 5% | 459 | +359% |
| .io | 2% | 181 | +81% |
| .com | 1% | 342 | +242% |
| .uk | 1% | 182 | +82% |
| .app | 1% | 415 | +315% |
| .co.uk | 1% | 300 | +200% |
| .xyz | 1% | 185 | +85% |
| .vip | 1% | 257 | +157% |
.ai footnote: .ai registrations require special treatment because .ai does not default to standard one-year registration behavior. Do not describe .ai multi-year volume as purely voluntary long-term commitment without this caveat.
Multi-year behavior can indicate stronger intent, but registry rules matter. The safest public framing is to describe multi-year rates as commitment signals only after accounting for TLD-specific registration policies.
Conclusion
The clearest takeaway from Q1 2026 is that the domain market has stable anchors and fast-moving pockets, and those two things coexist. .com stayed #1. .top stayed #2. But .info and .digital surged, and several previously prominent TLDs nearly disappeared.
Survey sentiment and platform data showed the same kind of split: investors believe new gTLDs are gaining, but their own buying behavior still leans toward legacy extensions. That perception gap is a useful context when interpreting what's driving demand.
For the most accurate read on any TLD, look at multiple signals together: activity rank, index movement, user type, acquisition channel, aftermarket activity, grace-delete rates, and multi-year rates. Each one describes a different dimension of demand quality, and they don't always move together.